The DePIN Data Problem
Putting It Together
The metrics above form a coherent picture of Akash's health: providers offering supply, capacity that is active versus idle, and the utilization that reveals real demand. Pulled together, they answer the questions that matter for provisioning and diligence — not "how big is Akash?" but "is Akash's compute actually being used, and at what effective price?"
That is the difference between a stats page and a decision tool. We normalize all of these into canonical, verifiable concepts so you can answer the question for Akash, then ask the same question of any other network in the same query.
What "Akash Stats" Should Mean
A useful Akash stats endpoint answers the supply-side questions that matter for provisioning and analysis: how many providers are active, how much CPU and GPU capacity is available, what utilization looks like, and how pricing is trending. The trap is that these figures live across different sources with different freshness, so a single reliable number requires reconciliation.
The Supply-Side Metrics
- Active providers — participants offering compute right now.
- Registered vs. active capacity — the gap between what Akash advertises and what is actually working.
- Utilization — active leases over registered capacity; the real demand signal.
- Pricing trends — cost per unit over time, which fluctuates with supply and demand.
verify_url. We normalize them into canonical concepts so an analyst or agent can compare Akash against other compute networks without reverse-engineering different schemas.
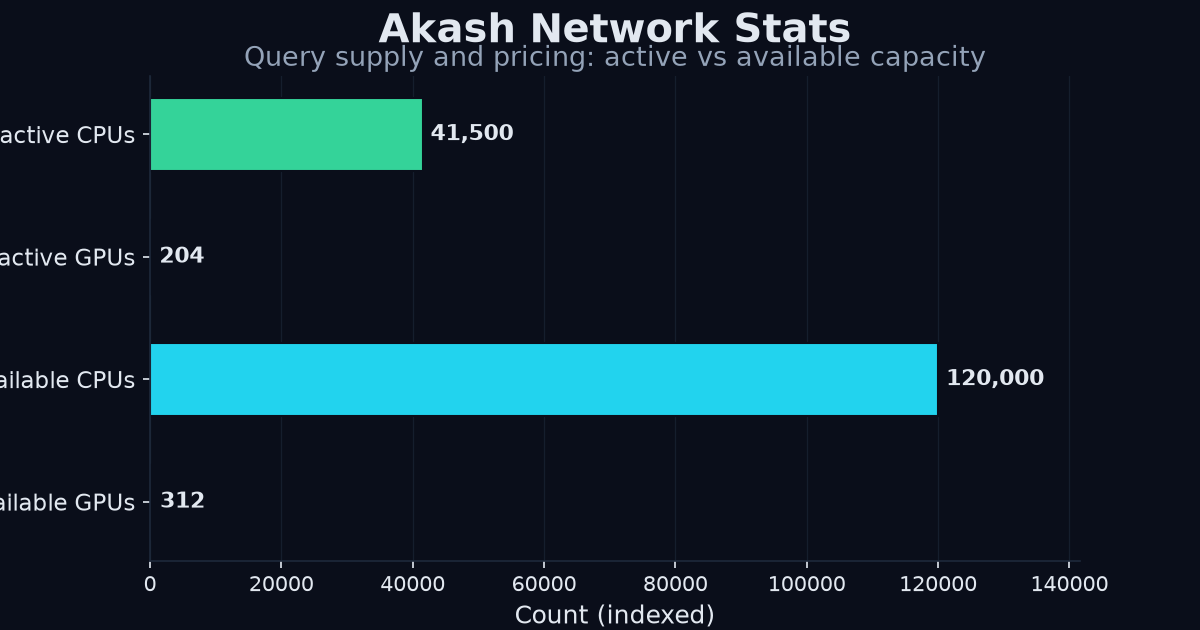
Akash is the deepest compute network in DePIN coverage for a simple reason: it publishes real, first-party telemetry — active GPU counts, active CPU counts, available capacity, and lease activity straight from the Akash console. That's rare, and it makes Akash one of the few networks where you can actually measure supply and utilization rather than guess.
But there's a catch. The raw telemetry is fragmented. GPU active counts, CPU active counts, memory in use, and available capacity all live on different parts of the console with different names and different update cadences. If you want Akash network stats you can act on, you need to normalize all of it into one canonical picture.
The Supply Story Hides in the Gap
The most important Akash statistic isn't any single number — it's the gap between registered and active supply. Registered capacity is what the network advertises. Active capacity is what's actually working. For a utilization analysis of Akash:
- GPU active vs. GPU available tells you how tight the GPU market is.
- CPU active vs. CPU available tells you the same for general compute.
- Memory active vs. memory available rounds out the picture.
Pricing: The Second Half of the Story
Supply data answers "how much is there?" Pricing answers "what does it cost?" Akash leases settle in AKT, so an agent building on Akash needs both the utilization picture and the live AKT-denominated pricing in the same query — otherwise it's computing cost in stale currency.
Query Akash Stats Yourself
# Akash supply + market data in one call
curl "https://kairossignal.com/v1/networks/akash" \
  -H "X-API-Key: $KS_API_KEY"
Utilization-relevant fields only
curl "https://kairossignal.com/v1/networks/akash?fields=gpu_active,gpu_available,cpu_active,cpu_available,memory_active"
Canonical comparison of compute utilization across Akash, io.net, and Render
curl "https://kairossignal.com/v1/compare?concept=GPU_UTILIZATION"
Every field carries a verify_url — for the supply side it points at Akash's own console; for pricing it points at the AKT market feed. You can open any source and confirm the number yourself.
Why Provenance Matters for Akash
Akash's native fields (GPU_ACTIVE, GPU_AVAILABLE, etc.) get mapped into canonical concepts with declared units. The daily batch is Merkle-rooted and timestamped to Bitcoin via OpenTimestamps, so the utilization you compute today is provably the utilization that was true today. A backtest built on Akash supply data gets the point-in-time value — not a restated one.
---
This is a data product. Kairos Signal publishes no trading signals, performance returns, win rates, or accuracy claims.---
Try it yourself
Query the live catalog, supply telemetry, and provenance receipts directly: /v1/supply, /v1/provenance on the REST API.
Related reading: Akash network data · akash api · akash network compute pricing api how to query · compute supply across Akash, io.net, Aethir
Start with a free API key — $5 in credits, no credit card — and query the live networks, their series, and the MCP server. Try the API free → · See pricing
---
Get Started With DePIN Intelligence
Kairos Signal provides verifiable, provenance-first telemetry for DePIN networks, including first-party supply data read directly from a network's own API or blockchain. Every value carries a verify_url you can check yourself, and each daily batch is Merkle-rooted and anchored to Bitcoin.
Every API response is signed with ed25519 and timestamped. You can prove what was served and when, months later. That is what we mean by provenance-first.
Related reading: DePIN Intelligence Guide · DePIN Telemetry · How to Query DePIN Data · DePIN Data Verification · Pricing