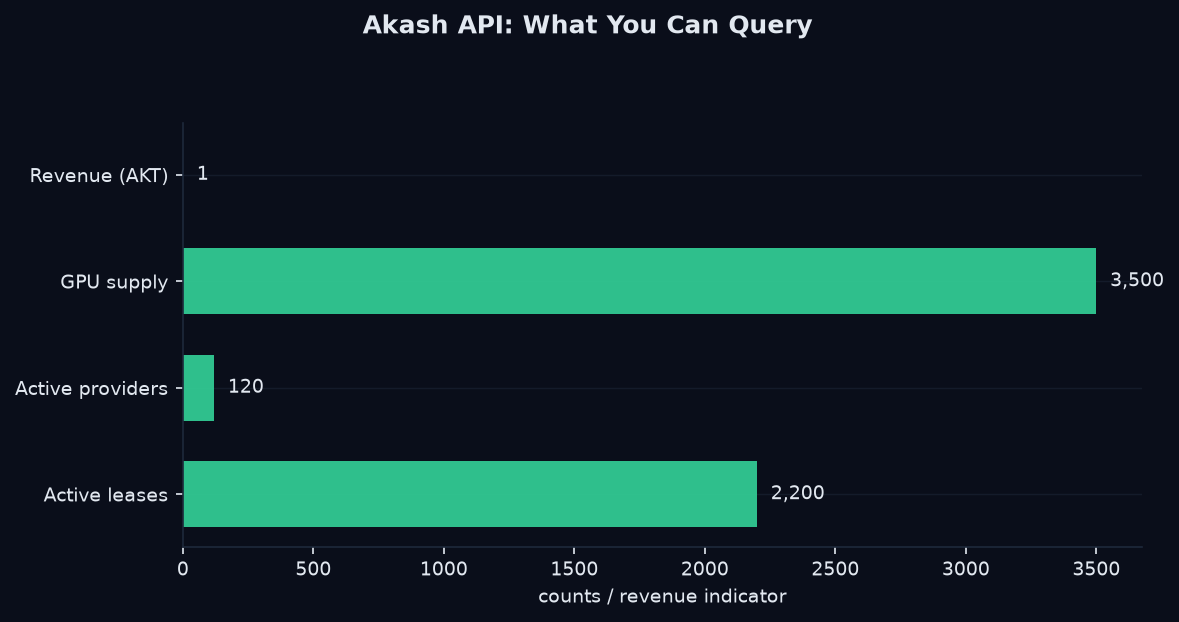
The Akash API, Made Queryable
Akash publishes real first-party telemetry, which makes it one of the most queryable networks in DePIN. But the raw console data is fragmented across fields with different names and cadences. This tutorial walks through the three queries that matter most — active providers, GPU supply, and revenue — using canonical concepts so the numbers are comparable.
1. Active Providers
Provider count is the network's workforce. It answers "how many machines are actually offering compute?" We read this from Akash's first-party data and normalize it into a canonical concept.
curl "https://api.kairossignal.com/v1/networks/akash?fields=active_providers" \
  -H "X-API-Key: *"
The response carries source, as_of, verify_url (pointing at Akash's own console), and a freshness verdict. Open the verify URL to confirm the provider count yourself.
2. GPU Supply
GPU supply is the demand signal in compute DePIN. The key is not total registered GPUs but the split between active and available — that gap is utilization.
# GPU active vs available — the utilization picture
curl "https://api.kairossignal.com/v1/networks/akash?fields=gpu_active,gpu_available" \
  -H "X-API-Key: *"
Compare GPU utilization across the whole compute category
curl "https://api.kairossignal.com/v1/compare?concept=GPU_UTILIZATION&category=compute"
When active GPU climbs while available shrinks, demand is absorbing supply. When registered grows but active is flat, that's idle inventory — a fundamentally different signal.
3. Revenue
Revenue answers "is the network actually earning?" Akash leases settle in AKT, so revenue data is AKT-denominated and pulled from the network's activity layer, with the AKT market price layered on top for a USD read.
# Revenue / protocol fee for Akash
curl "https://api.kairossignal.com/v1/network/AKT/revenue" \
  -H "X-API-Key: *"
Revenue across all compute networks
curl "https://api.kairossignal.com/v1/compare?concept=PROTOCOL_FEE&category=compute"
The AKT-denominated value and the market data are both first-party / verifiable, so you're not computing cost in stale currency.
Building a Complete Akash Monitor
Here is how the three queries compose into a working monitor. Pull providers and GPU supply at your polling cadence, and revenue daily:
# Poll providers + GPU every 5 minutes
curl "https://api.kairossignal.com/v1/networks/akash?fields=active_providers,gpu_active,gpu_available" \
  -H "X-API-Key: *"
Snapshot revenue daily
curl "https://api.kairossignal.com/v1/network/AKT/revenue" \
  -H "X-API-Key: *"
Because every value carries an as_of timestamp, you can build a time series yourself, or use the built-in supply history endpoint for trend analysis.
Why Canonical Concepts Matter
Akash's native field names (GPU_ACTIVE, ACTIVE_PROVIDERS) map into 38 canonical concepts with declared units. That is what lets you compare Akash against io.net and Render without reverse-engineering three schemas. One query, comparable numbers.
Every daily batch is Merkle-rooted and timestamped to Bitcoin via OpenTimestamps. The utilization or revenue you compute today is provably the value that was true today.
FAQ
How often is Akash data updated? We poll Akash's first-party telemetry on its own cadence; each value carries anas_of timestamp and a freshness verdict so you know exactly how current it is.
Do I need to parse Akash's native schema? No. Fields are normalized into canonical concepts. You query gpu_active, not Akash's raw field name.
Can I verify the data? Yes — every value has a verify_url pointing at Akash's own console, plus a Merkle root / Bitcoin timestamp on the daily batch.
Full API Access
These are three of the 19 live REST endpoints at https://api.kairossignal.com. Pricing starts at $0 free and scales to $199/mo design partner (forever price lock, $499/mo pro, and $2000/mo enterprise.
Combining the Three Queries Into a Signal
The three Akash queries — providers, GPU supply, and revenue — are each useful alone, but their real power is combined. A complete Akash health read looks like this:
- Providers tell you the size of the workforce.
- GPU supply (active vs available) tells you how tight the market is.
- Revenue tells you whether that activity is being monetized.
Automating Akash Monitoring
Because every value carries a verify_url and a freshness verdict, you can automate verification into your monitoring loop. An agent or script can fetch the verify_url, confirm the number at Akash's own console, and only act when the source matches. That turns a static dashboard into a self-auditing system that trusts nothing it hasn't confirmed.
Read more: Akash Network Data · DePIN Data Feeds · How to Query DePIN Data
---
This is a data product. Kairos Signal publishes no trading signals, performance returns, win rates, or accuracy claims.---
Try it yourself
Query the live catalog, supply telemetry, and provenance receipts directly: /v1/supply, /v1/provenance on the REST API.
Related reading: Akash network data · akash network compute pricing api how to query · compute supply across Akash, io.net, Aethir · the DePIN developer guide
Design-partner seats are capped at 20 at a lifetime-locked $199/mo (full API access, every published endpoint, MCP server, Bitcoin-anchored provenance). After seat 20 the price becomes $249/mo. Claim a design-partner seat → · See pricing---
Get Started With DePIN Intelligence
Kairos Signal provides verifiable, provenance-first telemetry for DePIN networks, including first-party supply data read directly from a network's own API or blockchain. Every value carries a verify_url you can check yourself, and each daily batch is Merkle-rooted and anchored to Bitcoin.
Every API response is signed with ed25519 and timestamped. You can prove what was served and when, months later. That is what we mean by provenance-first.
Related reading: DePIN Intelligence Guide · DePIN Telemetry · How to Query DePIN Data · DePIN Data Verification · Pricing