Telemetry Is Not Market Data
There is a category error hiding in most DePIN analytics: treating the token chart as the network's report card. Telemetry is different. Telemetry is the measurement of the physical layer — the nodes, the GPUs, the storage bytes, the bandwidth — that a DePIN network exists to coordinate.
Our definition is strict. A network only counts as having telemetry when we read it from a first-party source: the network's own API, its RPC chain, or a first-party stats endpoint. That matters because secondhand and modeled numbers inherit the aggregator's assumptions. First-party telemetry lets us point to the exact endpoint that produced the number.
The Numbers
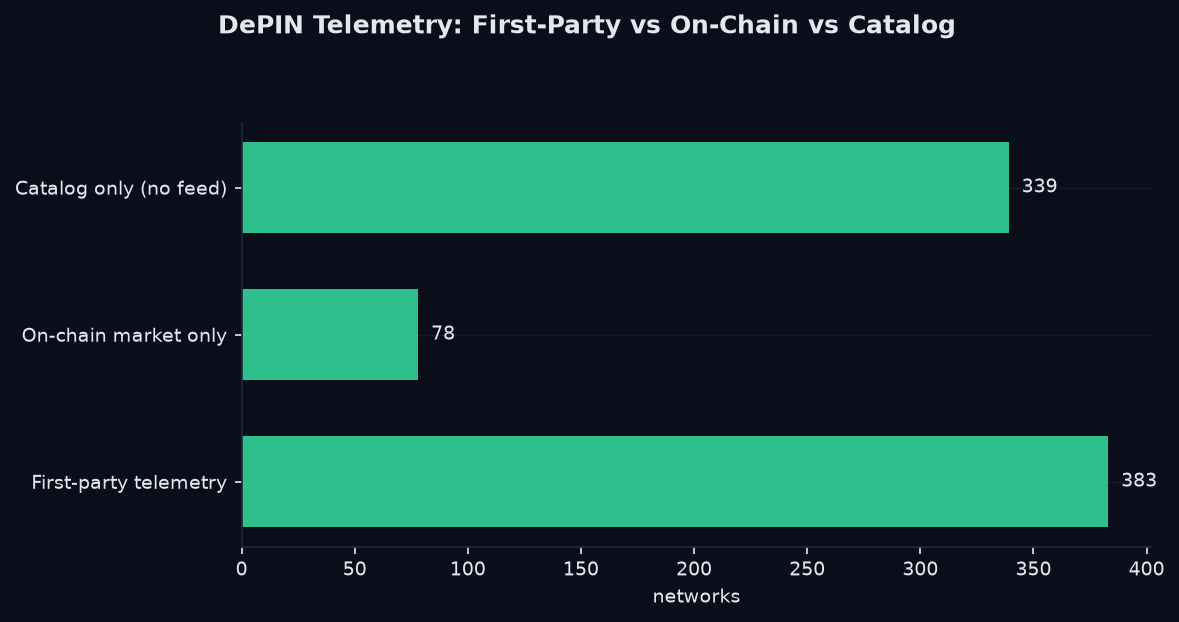
Of the 372 networks we serve live data for, 296 carry first-party telemetry. The remaining 78 are on-chain market only — token supply and price from chain state, with no infrastructure telemetry. A further 339 catalog entries have no public feed and are labeled catalog_only. In total that is 11,857 live series from 69 distinct sources, stored in ClickHouse at roughly 697K rows, served through 19 live REST endpoints.
The Supply Layer
The metric that matters most in DePIN is supply — and specifically the split between what a network advertises and what it actually deploys:
- Registered supply is what the network's registry says is attached.
- Active supply is what is actually working and answering.
How We Read 296 Networks
There is no single wire format in DePIN. Each network exposes its data differently, which is why we run a fleet of collectors across 69 distinct data sources:
subtensor_rpc — 129 networks (SCALE-encoded substrate storage)evm_blockscout — 118 networks (holders, transfers, gas)bsc_rpc — 50 networks (BSC token supply)solana_rpc — 49 networks (Solana L1 + SPL tokens)first_party_api — 44 networks (per-network stats APIs)ethereum_rpc — 32 networks (Ethereum token supply)Each collector handles a different wire format, applies the network's field mapping, and writes normalized rows into ClickHouse. This is the hard engineering nobody sees — and the reason first-party telemetry is a moat rather than a commodity.
Provenance on Every Value
Telemetry is only worth trusting if it is verifiable. Every value we serve carries:
source— the upstream endpointas_of— when we read itverify_url— a URL you can open to confirm the numberfreshness_verdict— fresh, stale, or missing (never zero-filled)
Query Telemetry Yourself
# All live networks and their coverage tier
curl "https://api.kairossignal.com/v1/networks" -H "X-API-Key: *"
Supply telemetry for one network
curl "https://api.kairossignal.com/v1/networks/akash?fields=gpu_active,gpu_available" \
  -H "X-API-Key: *"
Verify any value independently
curl "https://api.kairossignal.com/v1/verify/{value_id}"
Every response carries a verify_url. Open it, and you have the receipt.
What Telemetry Tells You That Charts Don't
A token chart tells you what the market thinks the network is worth. Telemetry tells you what the network is actually doing. A compute network whose active GPU count is flat while its price rallies is a network the market is pricing ahead of reality. A storage network whose active deals are climbing is one that is genuinely being used. The divergence between the two is where the real signal lives.
FAQ
Why is first-party sourcing so important? Because a secondhand number inherits the middleman's assumptions. First-party telemetry lets you open theverify_url and confirm the value against the network's own API or chain — no trust in the aggregator required.
What is the registered vs active split? Registered supply is what the network advertises; active supply is what is actually working. The gap is the utilization signal — and it is the single most useful number in DePIN telemetry.
How do I trust historical telemetry? Each daily batch is hashed into a Merkle root and timestamped to Bitcoin via OpenTimestamps. Any historical value is cryptographically provable.
Try the API live → · Full endpoint reference →
Telemetry in the Wild: What 296 Networks Actually Reveal
Reading telemetry across 296 networks surfaces patterns that a single dashboard hides. Compute networks cluster around active-GPU and active-lease counts. Storage networks center on providers, raw byte power, and active deals. Wireless and sensor networks track station and device counts. Because every one of these is normalized into a canonical concept, you can study a category as a whole — and spot the outliers that a per-network view would miss.
A useful exercise is the registered-versus-active sweep. Pull the same canonical supply concept across a category and rank by the active-to-registered ratio. The networks at the top of that ranking are the ones with the most working capacity relative to their advertising. The ones at the bottom are carrying idle inventory. That single sweep is one of the highest-signal analyses you can run on DePIN — and it only works because the underlying telemetry is first-party and comparable.
The other pattern worth watching is divergence between market data and telemetry. When a network's token rallies but its active node count is flat, the market is pricing ahead of reality. When telemetry climbs but the token lags, the market is underpricing working infrastructure. Neither direction is a signal in isolation — but the divergence itself is information that only exists when you have both layers in the same query.
What We Refuse to Do
Two things separate honest telemetry from vanity dashboards. First, we never zero-fill missing values. If a network stops reporting, the value is labeled missing, not 0 — because zero is a real number that would poison downstream analytics. Second, we label what we cannot measure. The 339 networks with no public feed are marked catalog_only, not silently inflated into coverage. Telemetry is only trustworthy when its boundaries are honest, and that honesty is a deliberate design choice, not an accident.
The Query Pattern
# Sweep active vs registered across a category
curl "https://api.kairossignal.com/v1/compare?concept=NODES_ACTIVE&category=compute" \
  -H "X-API-Key: *"
Watch divergence: telemetry + market in one call
curl "https://api.kairossignal.com/v1/networks/akash?fields=gpu_active,supply,price"
Run those two patterns and you have the core of a DePIN monitoring system built on verifiable telemetry.
Read more: DePIN Intelligence: The Complete Guide · DePIN On-Chain Data · DePIN Network Data
---
This is a data product. Kairos Signal publishes no trading signals, performance returns, win rates, or accuracy claims.Get Started With DePIN Intelligence
Kairos Signal provides verifiable, provenance-first telemetry for DePIN networks, including first-party supply data read directly from a network's own API or blockchain. Every value carries a verify_url you can check yourself, and each daily batch is Merkle-rooted and anchored to Bitcoin.
Every API response is signed with ed25519 and timestamped. You can prove what was served and when, months later. That is what we mean by provenance-first.
Related reading: DePIN Intelligence Guide · DePIN Telemetry · How to Query DePIN Data · DePIN Data Verification · Pricing