The Scarce Layer
Every DePIN network publishes a token price. Almost none publish clean, verifiable infrastructure telemetry — the actual measurement of nodes online, GPUs deployed, storage bytes active, bandwidth moving. That scarcity is the whole opportunity.
Here is the honest story: of our cataloged DePIN networks, only some have live data, and fewer still carry first-party infrastructure telemetry. Many are directory listings with no public feed at all, and others have token supply and market data but no infrastructure layer.
Infrastructure data is the scarce layer — and it is the layer that tells you whether a network actually works.
Why It's Scarce
Infrastructure telemetry is hard to produce, and the difficulty compounds:
- Wire formats vary wildly. One network exposes JSON, another SCALE-encoded substrate storage, another a dashboard with no API at all.
- Field names are inconsistent.
DEVICES_ACTIVE,GPU_ACTIVE,ACTIVE_NODES,WORKERS_ONLINE— 89 native names that map to just 38 canonical concepts. - Most networks have no public feed. For 339 networks, there is literally nothing to collect. That's a coverage gap, not a collector failure.
- Temporal history is un-accelerable. A day of telemetry not recorded is gone forever. You cannot buy back yesterday's node count.
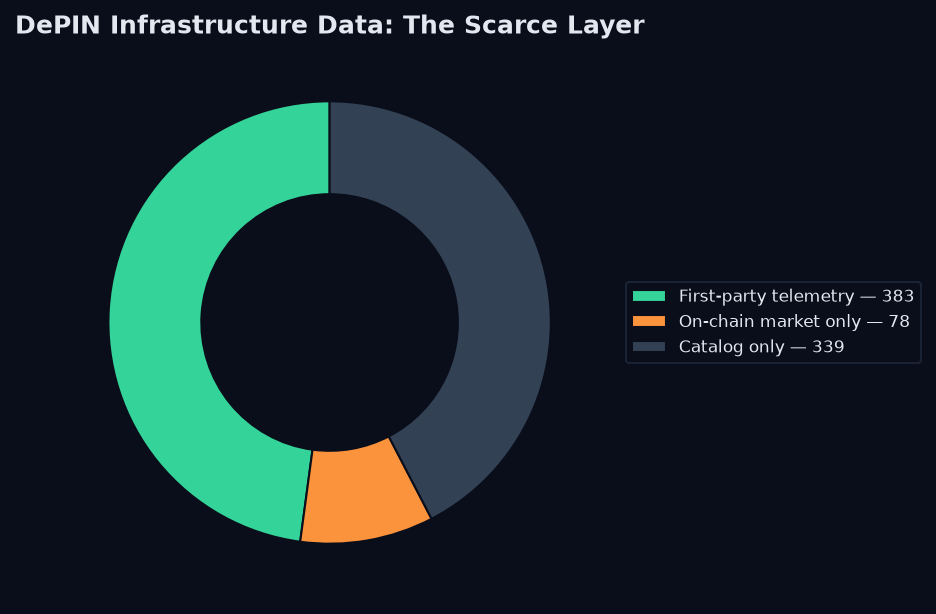
The Coverage Split, Visualized
By coverage tier:
| Tier | Networks | |---|---| | First-party infrastructure telemetry | 296 | | On-chain market only | 78 | | Catalog only (no feed) | 339 |
The 296 first-party networks are the real asset. Every one of them is read directly from the network's own API, RPC chain, or first-party stats endpoint — no aggregator in the path. For 44 networks we run dedicated first_party_api collectors.
What Infrastructure Data Enables
With infrastructure telemetry, questions that were previously unanswerable become routine:
- Registered vs active supply. Is capacity actually deployed, or idle inventory?
- Cross-network utilization. Compare GPU utilization across Akash, io.net, and Render in one query.
- Node count integrity. Verifiable active nodes, not marketing-page numbers.
- Protocol fees. Which networks actually generate revenue, from chain state.
Why Telemetry Is Harder Than Market Data
Market data is comparatively easy: prices and market caps are standardized, centralized, and cheap. Telemetry is the opposite — it lives at the network edge, in proprietary formats, behind rate limits, with no standard schema. That is exactly why aggregators default to market data and why genuine infrastructure telemetry is rare and valuable.
The Data Moat
This is why infrastructure data is a moat and not just a feature. The temporal history cannot be bought. We have been collecting telemetry on these networks day over day, which means our store — 11,857 live series, ~697K rows in ClickHouse — contains a history that starts accumulating the moment collection begins. Starting your own collector today means your trend window starts today.
Query the Scarce Layer
# First-party telemetry networks only
curl "https://api.kairossignal.com/v1/networks?tier=first_party"
Infrastructure supply for a compute network
curl "https://api.kairossignal.com/v1/networks/akash?fields=gpu_active,gpu_available"
Cross-network utilization
curl "https://api.kairossignal.com/v1/compare?concept=GPU_UTILIZATION"
Every value carries a verify_url and the daily batch is Merkle-rooted and anchored to Bitcoin. The scarce layer is also the verified layer.
FAQ
Why do so few networks have infrastructure data? Because most don't publish a programmatic feed, and we refuse to model estimates. If a network exposes no verifiable telemetry, we label itcatalog_only rather than fabricate numbers.
Is infrastructure data more valuable than market data? For diligence, yes. Market data tells you what the token trades at; infrastructure data tells you whether the network is actually working and earning. The two are complementary, but telemetry is rarer and more decision-relevant.
What is the registered vs active split? Registered is advertised supply; active is working supply. The gap is the utilization signal — the single most useful number in infrastructure telemetry.
Access the infrastructure layer → · Get a free key →
The Engineering That Makes It Possible
Reading infrastructure telemetry from 296 networks is a permanent engineering commitment, and the hard parts are invisible. Every network uses a different wire format. Every network names its fields differently. Every network has its own rate limits, failure modes, and update cadence. Someone has to write a collector for each one, keep it running as the source changes, and map its fields into a canonical schema — with tests that refuse a bad value before it poisons the store.
That is the real cost of infrastructure data, and it's why the layer is scarce. It is not a weekend project; it is a fleet of collectors that must be maintained forever. Anyone who tells you infrastructure telemetry is easy to aggregate is either not doing it or not verifying it.
The Value of an Honest Boundary
The boundary between measured and unmeasured is itself information. Knowing which networks are covered tells you where the ecosystem is transparent and where it is opaque. The catalog-only networks are the opaque zone — projects that exist but publish no verifiable feed. Mapping that boundary lets researchers focus manual work where it's needed and trust automated pipelines where coverage is real.
Why the Temporal Layer Compounds
Every day of collection adds to the history, and history compounds. A 30-day trend requires 30 days of data; a 90-day trend requires 90. Because we've been collecting day over day, the store now holds ~697K rows of temporal telemetry. That history is a moat precisely because it cannot be bought — starting a collector today means your trend window starts today, and every day you wait, the gap widens.
Read more: DePIN Coverage Map · DePIN Telemetry · DePIN Infrastructure Data vs Alternatives
---
This is a data product. Kairos Signal publishes no trading signals, performance returns, win rates, or accuracy claims.---
Try it yourself
Query the live catalog, supply telemetry, and provenance receipts directly: /v1/supply, /v1/provenance on the REST API.
Related reading: how we read supply telemetry from 296 networks · DePIN network data: 372 networks, 138 sources · DePIN Intelligence guide · DePIN node-count data
Design-partner seats are capped at 20 at a lifetime-locked $199/mo (full API access, every published endpoint, MCP server, Bitcoin-anchored provenance). After seat 20 the price becomes $249/mo. Claim a design-partner seat → · See pricing---
Get Started With DePIN Intelligence
Kairos Signal provides verifiable, provenance-first telemetry for DePIN networks, including first-party supply data read directly from a network's own API or blockchain. Every value carries a verify_url you can check yourself, and each daily batch is Merkle-rooted and anchored to Bitcoin.
Every API response is signed with ed25519 and timestamped. You can prove what was served and when, months later. That is what we mean by provenance-first.
Related reading: DePIN Intelligence Guide · DePIN Telemetry · How to Query DePIN Data · DePIN Data Verification · Pricing Correction 2026-09-25: this post called our catalog entry count a count of DePIN networks; that count includes superseded rows and Bittensor subnet rows. It has been removed, together with some present-tense coverage counts written beside it. Current coverage figures: /v1/networks.