The Edge of the DePIN Data Map
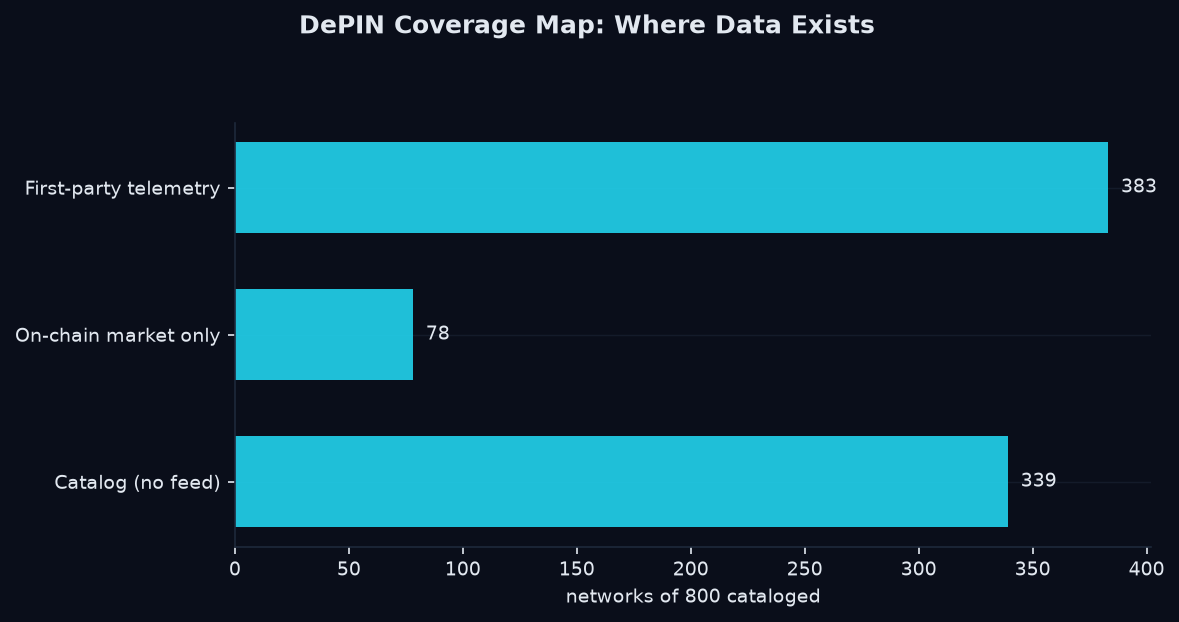
Every data product has a boundary where the data ends. The most honest thing a provider can do is draw that boundary clearly. Here is ours, in the current numbers:
- 327 with live data
- 296 with first-party telemetry
- 78 on-chain market only
- 339 with no public feed at all (
catalog_only)
catalog_only, and do not fabricate numbers for them.
Where Data Exists
The covered territory is concentrated in a few source types. Here is where the 327 live networks get their data:
subtensor_rpc — 129 (subnet telemetry)evm_blockscout — 118 (holders, transfers, gas)bsc_rpc — 50 (BSC token supply)solana_rpc — 49 (Solana + SPL)first_party_api — 44 (per-network stats)ethereum_rpc — 32 (Ethereum token supply)The categories are unevenly served. Compute (Akash, io.net, Render) and storage (Filecoin, Storj) have deep first-party telemetry because they publish it. Many sensor and wireless networks publish dashboards with no API, which pushes them toward the catalog-only tier.
Why the Gaps Differ by Category
The coverage map is not uniform — it reflects how networks expose data. Compute and storage networks tend to publish telemetry because they must account for real workloads. Sensor and wireless networks often present a dashboard as their "data" with no programmatic feed underneath. That structural difference is why compute and storage dominate the first-party tier, and why many sensor networks sit in the gap.
Where It Doesn't
Three reasons a network falls into the gap:
- No public feed — the network simply doesn't expose data programmatically.
- No first-party source — the only data is secondhand, so we won't model an estimate.
- No verifiable telemetry — market data exists but infrastructure data doesn't, leaving it in the on-chain-only tier.
Why Naming the Gap Matters
A coverage map that only shows what it covers is not a map; it's marketing. When you know the catalog-only networks, you know where your research needs manual work and where it can rely on verified feeds. That's the difference between a data provider and a data tool.
Query the Map
# The full coverage map, with tiers
curl "https://api.kairossignal.com/v1/networks" \
  -H "X-API-Key: *"
Just the gap (catalog only)
curl "https://api.kairossignal.com/v1/networks?tier=catalog_only"
Just what's verifiable
curl "https://api.kairossignal.com/v1/networks?tier=first_party"
Every entry carries source, as_of, verify_url, and a freshness verdict — the provenance contract applies to the map itself.
FAQ
Why do you admit where you don't have data? Because honesty about gaps is what makes the covered data trustworthy. If we pretended every catalogued network was fully covered, you couldn't trust the ones that genuinely are. Is the coverage map static? No. As networks expose feeds, they move from catalog-only into the live tiers. The map is a living picture, not a fixed snapshot. What is the biggest gap? The 339 networks with no public feed at all — largely sensor and wireless projects that publish dashboards without APIs. Explore the coverage map → · Read the docs →Why Coverage Is a Map, Not a Number
A network count is a headline, but it's not the useful part. The useful part is the shape of the coverage — where it's dense, where it's thin, and where it ends. That shape is what tells you which analyses you can run automatically and which need manual work.
The map is dense in compute and storage because those networks publish telemetry — they must account for real workloads. It's thin in many sensor and wireless categories, which often present dashboards with no programmatic feed underneath. That structural asymmetry is information in its own right: it tells you where the ecosystem is transparent and where it's opaque.
The Catalog-Only Tier as a Research Frontier
The catalog-only networks are not failures — they're the frontier. They're projects that exist but expose no verifiable feed, which means any analysis of them requires manual research. Knowing that boundary is exactly what a good coverage map provides. When you filter to catalog-only, you're seeing the set of networks where the data infrastructure is missing, and that's where your own effort has to concentrate.
How Coverage Changes Over Time
Coverage is not static. As networks expose feeds, they migrate from catalog-only into the live tiers. A map that's honest about gaps today is also a map that can show progress tomorrow. That dynamism is why we track tiers per entry rather than a single aggregate number — the shape of coverage is more informative than the headline.
Read more: The Complete DePIN Networks List · DePIN Infrastructure Data · DePIN Network Data
---
This is a data product. Kairos Signal publishes no trading signals, performance returns, win rates, or accuracy claims.---
Try it yourself
Query the live catalog, supply telemetry, and provenance receipts directly: /v1/supply, /v1/provenance on the REST API.
Related reading: DePIN infrastructure data · how we read supply telemetry from 296 networks · DePIN network data: 372 networks, 138 sources · DePIN Intelligence guide
Design-partner seats are capped at 20 at a lifetime-locked $199/mo (full API access, every published endpoint, MCP server, Bitcoin-anchored provenance). After seat 20 the price becomes $249/mo. Claim a design-partner seat → · See pricing---
Get Started With DePIN Intelligence
Kairos Signal provides verifiable, provenance-first telemetry for DePIN networks, including first-party supply data read directly from a network's own API or blockchain. Every value carries a verify_url you can check yourself, and each daily batch is Merkle-rooted and anchored to Bitcoin.
Every API response is signed with ed25519 and timestamped. You can prove what was served and when, months later. That is what we mean by provenance-first.
Related reading: DePIN Intelligence Guide · DePIN Telemetry · How to Query DePIN Data · DePIN Data Verification · Pricing Correction 2026-09-25: this post called our catalog entry count a count of DePIN networks; that count includes superseded rows and Bittensor subnet rows. It has been removed, together with some other present-tense coverage counts in this post. Current coverage figures: /v1/networks.