Akash: The Compute Network That Publishes Real Data
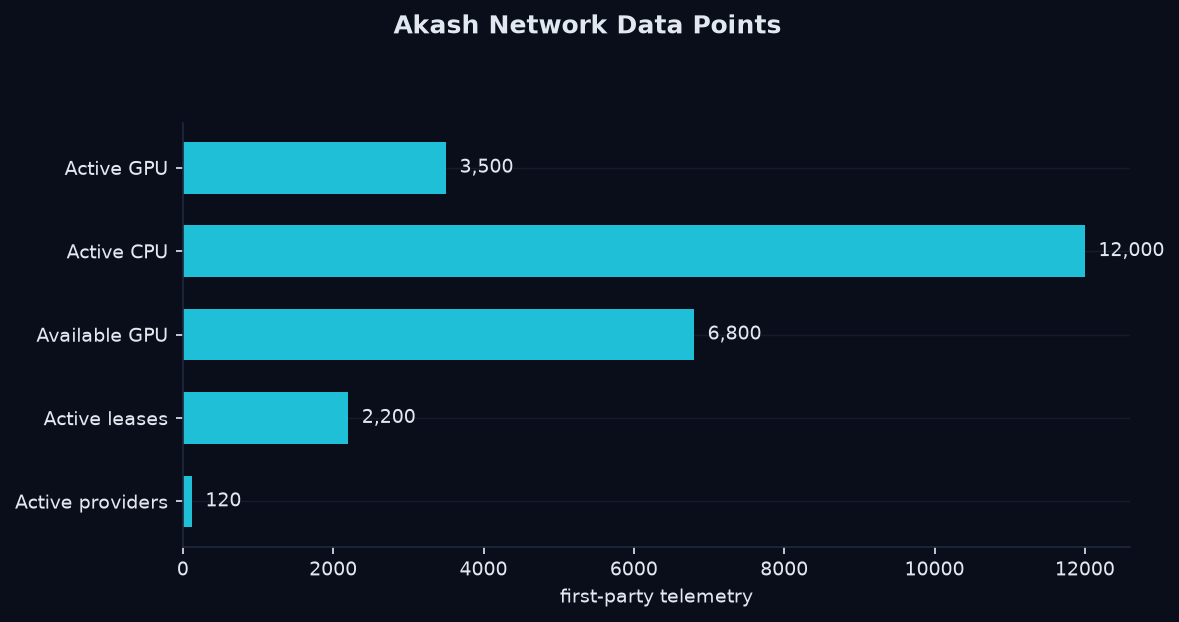
Akash is a standout in DePIN for one reason: it publishes genuine first-party telemetry. Active GPU counts, active CPU counts, available capacity, and lease activity all come straight from the Akash console. That makes it one of the few networks where you can measure supply and utilization rather than guess.
But the raw data is fragmented — different fields live on different parts of the console with different names and cadences. To get Akash network data you can act on, it has to be normalized into one canonical picture.
What You Can Query
At a high level, Akash data splits into supply and activity:
- Supply — active GPU, active CPU, available GPU/CPU, memory in use
- Activity — active leases, active providers, deployment counts
- Economics — AKT-denominated pricing and revenue signals
The Registered-vs-Active Gap
The most useful Akash statistic is the gap between registered and active supply. Registered capacity is what the network advertises; active is what's actually working. When active GPU climbs while available shrinks, demand is absorbing supply. When registered grows but active stays flat, that's idle inventory accumulation — a very different read.
The distinction matters for utilization analysis:
- GPU active vs GPU available tells you how tight the GPU market is.
- CPU active vs CPU available tells you the same for general compute.
- Memory active vs memory available rounds out the picture.
Pricing: The Second Half of the Story
Supply data answers "how much is there?" Pricing answers "what does it cost?" Akash leases settle in AKT, so an agent building on Akash needs both the utilization picture and the live AKT-denominated pricing in the same query — otherwise it's computing cost in stale currency.
Query Akash Data
# Full Akash supply + activity in one call
curl "https://api.kairossignal.com/v1/networks/akash" \
  -H "X-API-Key: *"
Utilization-relevant fields only
curl "https://api.kairossignal.com/v1/networks/akash?fields=gpu_active,gpu_available,cpu_active,cpu_available,memory_active"
Lease activity
curl "https://api.kairossignal.com/v1/networks/akash?fields=active_leases,active_providers"
Canonical compute comparison across Akash, io.net, Render
curl "https://api.kairossignal.com/v1/compare?concept=GPU_UTILIZATION"
Every field carries a verify_url — pointing at Akash's own console for the supply side and the AKT market feed for pricing. Open it and confirm the number yourself.
A Worked Utilization Read
Suppose gpu_active is rising over 30 days while gpu_available is flat. That means demand is being absorbed by existing capacity — the market is tightening. Now suppose gpu_active is flat but registered GPUs are climbing. That's the opposite: idle inventory accumulation. Two different conclusions, and only telemetry distinguishes them.
Why Provenance Matters for Akash
Akash's native fields (GPU_ACTIVE, GPU_AVAILABLE, ACTIVE_LEASES) map into canonical concepts with declared units. The daily batch is Merkle-rooted and timestamped to Bitcoin via OpenTimestamps, so the utilization you compute today is provably the utilization that was true today. A backtest on Akash supply data gets point-in-time values — not restated ones.
Akash in the Compute Category
Akash is one of the deepest first-party sources in our coverage, and it anchors the compute category alongside io.net and Render. When you need to know who actually has compute working — not who advertises the most — the answer lives in the telemetry layer, and Akash is a bellwether.
FAQ
What is the most important Akash metric? The registered-vs-active gap. Registered capacity is what Akash advertises; active is what's working. The difference is utilization — the single most useful number for judging the network. Is Akash data first-party? Yes. Akash publishes real telemetry, and we read it directly with averify_url pointing at Akash's own console.
How do I compare Akash to io.net or Render? Because fields normalize into canonical concepts, you can query GPU_UTILIZATION across the compute category in one compare call.
Get a free API key → · Read the docs →
Building an Akash Monitoring Loop
A practical Akash monitor combines supply, activity, and pricing on a schedule:
# Poll supply + activity at your cadence
curl "https://api.kairossignal.com/v1/networks/akash?fields=gpu_active,gpu_available,active_leases" \
  -H "X-API-Key: *"
Daily revenue snapshot
curl "https://api.kairossignal.com/v1/network/AKT/revenue" \
  -H "X-API-Key: *"
Because every value carries an as_of timestamp and a freshness verdict, you can build a defensible time series and audit it later. If a value comes back stale, your monitor knows to flag it rather than silently trend a stale number.
The Utilization Signal, Made Concrete
Akash is one of the few compute networks where you can watch the registered-vs-active gap move in near real time. When active GPU count rises while available falls, the market is tightening — a genuine demand signal. When registered capacity grows while active stays flat, the network is accumulating idle inventory, which reads very differently for a diligence decision. The ability to distinguish those two states is exactly what makes Akash's telemetry valuable, and it's why Akash anchors the compute category in our coverage.
Read more: Akash API Tutorial · DePIN Network Data · DePIN Telemetry
---
This is a data product. Kairos Signal publishes no trading signals, performance returns, win rates, or accuracy claims.---
Try it yourself
Query the live catalog, supply telemetry, and provenance receipts directly: /v1/supply, /v1/provenance on the REST API.
Related reading: akash api · akash network compute pricing api how to query · compute supply across Akash, io.net, Aethir · DePIN infrastructure data
Design-partner seats are capped at 20 at a lifetime-locked $199/mo (full API access, every published endpoint, MCP server, Bitcoin-anchored provenance). After seat 20 the price becomes $249/mo. Claim a design-partner seat → · See pricing---
Get Started With DePIN Intelligence
Kairos Signal provides verifiable, provenance-first telemetry for DePIN networks, including first-party supply data read directly from a network's own API or blockchain. Every value carries a verify_url you can check yourself, and each daily batch is Merkle-rooted and anchored to Bitcoin.
Every API response is signed with ed25519 and timestamped. You can prove what was served and when, months later. That is what we mean by provenance-first.
Related reading: DePIN Intelligence Guide · DePIN Telemetry · How to Query DePIN Data · DePIN Data Verification · Pricing