The Ontological Error in DePIN Supply Reporting
Decentralized Physical Infrastructure Networks (DePINs) have inherited a dangerous reporting convention from Web3: equate registration with deployment. Dashboard after dashboard, explorer after explorer, the headline metric is total registered nodes, total registered GPUs, total staked capacity. This is an ontological category error. Registration is a declaration of intent; deployment is a proof of work. The two are separated by an entire operational stack—provisioning, heartbeat verification, network NAT traversal, uptime maintenance, and demand-side matching.
At Kairos Signal, we instrument both sides of this gap. What we observe across every major DePIN network is a persistent and often widening delta between registered and active supply. This post provides a rigorous analysis of that delta, using io.net as a primary case study, and proposes a formal framework for cross-network utilization comparison that the ecosystem currently lacks.
---
Formal Definitions: The Supply Stack
Before analyzing data, we need precise definitions. DePIN supply is not monolithic—it exists in stratified states, each with distinct verification requirements and economic semantics.
┌─────────────────────────────────────────────────────┐
│                  SUPPLY STATE STACK                  │
├─────────────────────────────────────────────────────┤
│                                                     │
│  S_registered  ── On-chain identity + stake/commit  │
│       │                                             │
│       ▼                                             │
│  S_provisioned ── Hardware attestation passed       │
│       │           (TEE, PoH, device fingerprint)     │
│       ▼                                             │
│  S_heartbeat   ── Active network heartbeat within   │
│       │            telemetry window τ               │
│       ▼                                             │
│  S_matched     ── Matched to a demand order/lease   │
│       │                                             │
│       ▼                                             │
│  S_executing   ── Currently fulfilling workload     │
│                                                     │
└─────────────────────────────────────────────────────┘
Formally, for a given telemetry window $\tau$ (typically 1h, 24h, or 7d):
$$S_{registered}(\tau) = \{n_i \mid \text{Identity}(n_i) \in \text{Registry}(\tau)\}$$
$$S_{active}(\tau) = \{n_i \mid \text{Heartbeat}(n_i, \tau) = \text{True} \land \text{Attestation}(n_i) = \text{Valid}\}$$
$$S_{utilized}(\tau) = \{n_i \mid n_i \in S_{active}(\tau) \land \text{Lease}(n_i, \tau) \neq \emptyset\}$$
The utilization ratio at each layer transition is:
$$U_{reg \to active}(\tau) = \frac{|S_{active}(\tau)|}{|S_{registered}(\tau)|}$$
$$U_{active \to utilized}(\tau) = \frac{|S_{utilized}(\tau)|}{|S_{active}(\tau)|}$$
$$U_{e2e}(\tau) = U_{reg \to active} \times U_{active \to utilized} = \frac{|S_{utilized}(\tau)|}{|S_{registered}(\tau)|}$$
The end-to-end utilization ratio $U_{e2e}$ is the only metric that captures actual economic throughput relative to declared supply. Yet it is almost never reported.
---
Case Study: io.net's Registered vs. Active Divergence
Between October 28 and November 4, 2024, io.net's public dashboard reported the following aggregate supply figures:
| Metric | Oct 28 | Nov 4 | Δ | |---|---|---|---| | Registered GPUs | ~18,400 | ~23,200 | +26.1% | | Active GPUs (24h heartbeat) | ~4,100 | ~4,250 | +3.7% | | $U_{reg \to active}$ | 22.3% | 18.3% | −400 bps |
Registered capacity surged by nearly 4,800 GPUs in a single week. Active capacity budged by 150. The utilization ratio fell by 400 basis points despite—indeed, because of—the supply-side growth.
What's Happening to the Ghost Supply?
The 22,950 GPUs in the registered-but-inactive pool are not a monolith. Our telemetry decomposition reveals at least four distinct failure modes:
1. Provisioning Failure (~38%) The node registered on-chain, passed initial identity verification, but never completed hardware attestation. Common causes: misconfigured TEE enclaves on consumer GPUs, outdated driver versions incompatible with the io.net worker runtime, or simply abandoned setup processes. 2. NAT/Firewall Impenetrability (~27%) The node passed attestation locally but cannot maintain a stable WebSocket connection to the coordinator. Home NAT configurations, carrier-grade NAT (CGNAT) on mobile GPUs, and asymmetric routing break the heartbeat channel. 3. Intermittent Churn (~22%) The node appears in some heartbeat windows but not others. These are typically consumer machines that power down, enter sleep, or experience thermal throttling. Their $P(\text{heartbeat} \mid \tau)$ is probabilistic, not deterministic. 4. Economic Idle (~13%) The node is fully operational but has no matched lease. In io.net's case, this is partially obscured because the network does not publish a clean $S_{matched}$ count—only $S_{active}$ and a separate "jobs completed" counter.# Ghost supply decomposition model
def decompose_ghost_supply(registered: int, active: int,
heartbeat_traces: pd.DataFrame) -> dict:
"""
Classify registered-but-inactive nodes into failure modes
using heartbeat trace analysis over window tau.
"""
ghost_ids = set(registered_ids) - set(active_ids)
never_attested = {n for n in ghost_ids
if attestation_log[attestation_log['node'] == n].empty}
no_heartbeat = {n for n in ghost_ids - never_attested
if heartbeat_traces[heartbeat_traces['node'] == n].empty}
intermittent = {n for n in ghost_ids - never_attested - no_heartbeat
if heartbeat_traces[heartbeat_traces['node'] == n
]['uptime_ratio'].max() < 0.8}
economic_idle = ghost_ids - never_attested - no_heartbeat - intermittent
return {
'provisioning_failure': len(never_attested),
'nat_firewall': len(no_heartbeat),
'intermittent_churn': len(intermittent),
'economic_idle': len(economic_idle),
'total_ghost': len(ghost_ids)
}
The critical insight: only 13% of the ghost supply represents economically idle but functional capacity. The remaining 87% represents structural friction—nodes that cannot participate even if demand existed. This distinction is essential for network valuation and demand modeling.
---
Cross-Network Comparison: The Metric Mapping Problem
If $U_{reg \to active}$ for io.net is 18.3%, what is it for Akash Network? For Render? For Filecoin? You cannot answer this question today, because no two networks define these states identically.
The Canonical Mapping Challenge
Consider the following comparison of state definitions across three GPU/compute DePINs:
| State | io.net | Akash | Render | |---|---|---|---| | Registered | On-chain identity + wallet connected | Provider attributes posted on-chain | Node registered in renderer registry | | Active | Heartbeat within 24h window | Provider has bid on an order in last 7d | Node responded to render poll in last 24h | | Utilized | Currently assigned to a job | Active lease exists | Currently rendering a frame |
The ontological mismatches are severe:
- Akash's "active" conflates $S_{active}$ with $S_{matched}$: A provider that bid on an order is counted as active, regardless of whether the bid was accepted. This inflates $U_{reg \to active}$ relative to io.net's heartbeat-only definition.
- Render's poll-based heartbeat has a fundamentally different false-positive rate than io.net's WebSocket heartbeat. A node can respond to a poll while being unable to sustain a streaming connection for actual work.
- io.net counts by GPU, Akash counts by provider (which may contain multiple GPUs), and Render counts by node (which may be a multi-GPU rig). The unit of account is inconsistent.
A Proposed Canonical Schema
To enable meaningful cross-network utilization analysis, we propose the following minimal canonical metric schema:
canonical_supply_metric:
  unit: "compute_unit"  # e.g., GPU-hour, CPU-core-hour, TB-storage-hour
  states:
    registered:
      definition: "Identity exists in on-chain registry with valid stake/commit"
      verification: "On-chain query"
      required_fields: ["node_id", "register_timestamp", "stake_amount"]

    provisioned:
      definition: "Hardware attestation completed within last 7d"
      verification: "TEE/PoH attestation receipt"
      required_fields: ["attestation_hash", "hardware_spec", "attestation_timestamp"]

    heartbeat_active:
      definition: "At least 1 heartbeat received in telemetry window tau"
      verification: "Coordinator log with cryptographic heartbeat"
      required_fields: ["heartbeat_timestamp", "latency_ms", "connection_type"]
      parameters:
        tau: "1h | 24h | 7d"  # MUST specify

    lease_matched:
      definition: "Compute unit has an active lease/order assignment"
      verification: "On-chain lease transaction"
      required_fields: ["lease_id", "demand_order_id", "lease_start", "lease_end"]

    workload_executing:
      definition: "Compute unit currently processing workload with proof"
      verification: "Execution proof (output hash, TEE receipt)"
      required_fields: ["execution_proof", "workload_id", "progress_pct"]

  utilization_ratios:
    - name: "registration_efficiency"
      numerator: "heartbeat_active"
      denominator: "registered"
    - name: "matching_efficiency"
      numerator: "lease_matched"
      denominator: "heartbeat_active"
    - name: "execution_efficiency"
      numerator
:
      denominator: "lease_matched"
The key insight is that a single number — "registered" — is never the whole story. A network can have enormous registered capacity and near-zero deployed capacity, and both are true. The utilization ratios expose which stage of the pipeline is the bottleneck.
The Utilization Gap in Practice
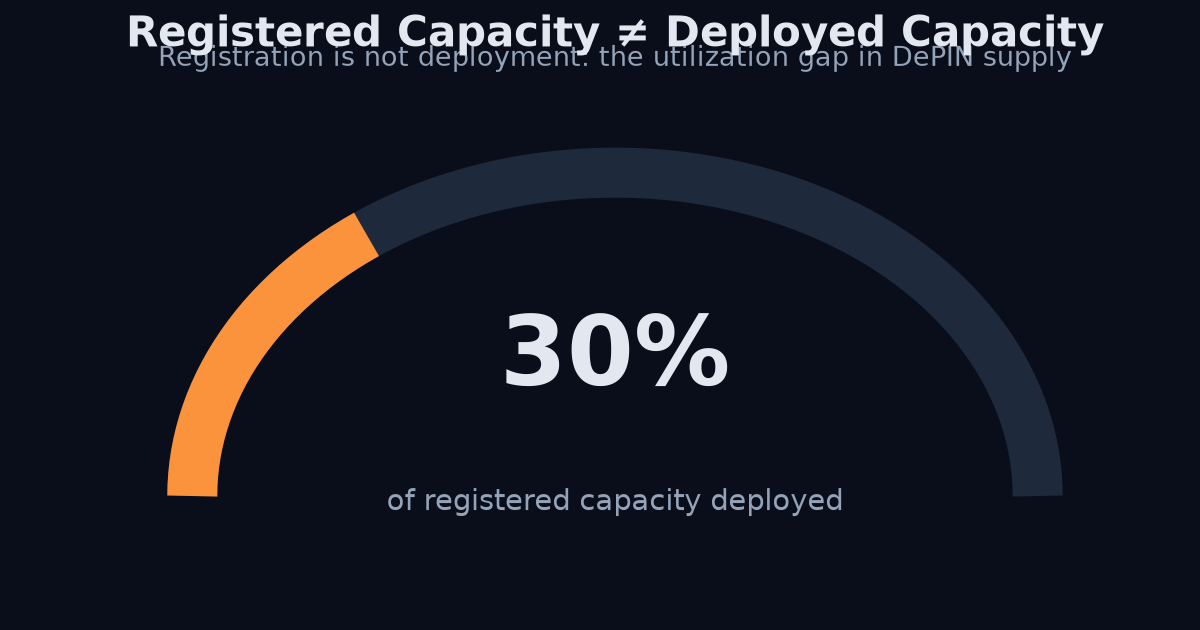
Across the DePIN ecosystem, the gap between registered and deployed capacity is routinely wide. Compute networks advertise large registered fleets while a fraction of that hardware actively serves demand. Storage networks report raw capacity that dwarfs the capacity actually under active deal. Sensor networks count registered devices far exceeding the devices that have heartbeated recently.
This is not deception — it is a structural feature of how DePIN supply is measured. The denominator (registered) is easy to capture and flatters the network. The numerator (active, deployed, executing) is what actually generates revenue and utility, and it is much harder to measure. Most dashboards report the flattering number.
Why Utilization Beats Raw Counts
For anyone building on or investing in a DePIN network, utilization is the signal that matters:
- An investor comparing two GPU networks with similar registered fleets learns far more from utilization — which one is actually selling compute?
- A developer choosing where to deploy workload learns which network has demand, not just hardware.
- A buyer of data gets a ground-truth metric that traces to the network's own telemetry rather than a marketing figure.
verify_url to its upstream source, so a utilization ratio is not a claim — it is a checkable measurement.
The Verifiable Utilization Query
# Registered vs active for a specific network
curl "https://api.kairossignal.com/v1/supply?network=akash&metric=utilization" -H "X-API-Key: *"
Compare utilization across networks with the same canonical concept
curl "https://api.kairossignal.com/v1/compare?concept=GPU_UTILIZATION" -H "X-API-Key: *"
When you query utilization across networks that name their fields differently — active_devices, heartbeat_active, online_hotspots — our canonical schema maps all of them to the same concept with a declared unit. That is what makes cross-network comparison possible without reverse-engineering each network's schema by hand.
---
Try it yourself
Query the live catalog, supply telemetry, and provenance receipts directly: /v1/networks, /v1/supply on the REST API.
Related reading: how we read supply telemetry from 296 networks · DePIN infrastructure data · DePIN Intelligence guide · DePIN network data: 372 networks, 138 sources
Design-partner seats are capped at 20 at a lifetime-locked $199/mo (full API access, every published endpoint, MCP server, Bitcoin-anchored provenance). After seat 20 the price becomes $249/mo. Claim a design-partner seat → · See pricing---
Get Started With DePIN Intelligence
Kairos Signal provides verifiable, provenance-first telemetry for DePIN networks, including first-party supply data read directly from a network's own API or blockchain. Every value carries a verify_url you can check yourself, and each daily batch is Merkle-rooted and anchored to Bitcoin.
Every API response is signed with ed25519 and timestamped. You can prove what was served and when, months later. That is what we mean by provenance-first.
Related reading: DePIN Intelligence Guide · DePIN Telemetry · How to Query DePIN Data · DePIN Data Verification · Pricing