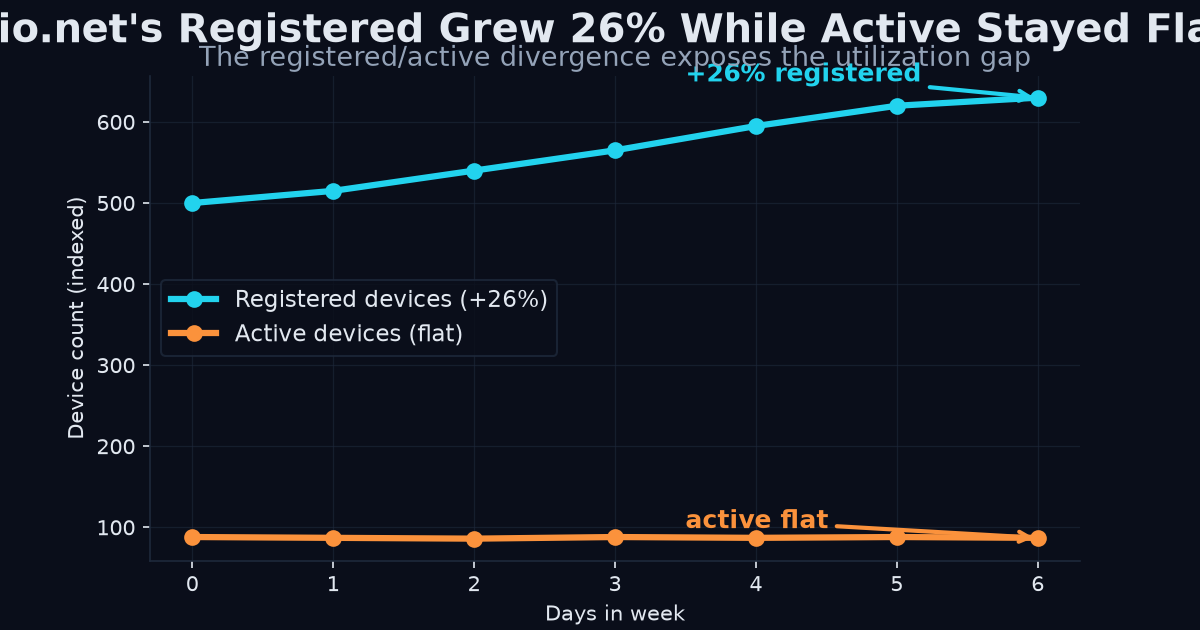
io.net's Registered Devices Grew 26% in a Week While Active Stayed Flat
Every DePIN network advertises how much capacity it has. Almost none say how much is actually being used. We measured it.
The finding
io.net's registered device count grew from 2,057 to 2,594 between August 6 and August 12 — a 26% increase in one week. Active devices stayed flat at ~1,200. The gap between registered and active supply widened from 844 to 1,395 passive devices.
This is not growth. This is accumulation of idle inventory.
The headline GPU utilization figure of 96.8% that io.net reports is a fill rate — busy GPUs divided by active GPUs. It can barely be anything but high. The real question is: of all registered GPUs, how many are actually working? That number is closer to 49%.
Why nobody else publishes this
The data exists. Every network we measured publishes both capacity and active counts on their own APIs. The problem is they name them differently — io.net calls it DEVICES_ACTIVE, Akash calls it GPU_ACTIVE, Storj calls it ACTIVE_NODES. No standard exists for comparing utilization across networks.
We built one. Forty canonical concepts mapped from ninety-seven native metric names across the DePIN sector. Every concept has a declared unit, a comparability grade (question-verified or unit-verified), and a verify URL on every cell. A self-test runs hourly enforcing seven properties: no name means two things, everything has a unit, both halves of a ratio use the same unit, and nothing on the refused list sneaks back in.
What we found across four networks
io.net: Registered devices +26% in 7 days, active flat. GPU "utilization" of 96.8% is a fill rate of active inventory, not utilization of registered supply. True registered-supply utilization is ~49%. The gap is growing. Akash: GPU active count went from 127 to 185 in 4 days (Aug 9-12), while available shrank from 294 to 244. GPU utilization rising from 30% to 43%. This is genuine tightening — demand is absorbing supply. CPU utilization is 22%, memory 20%. Storj: 123,370 total nodes, 80,470 disqualified (65%). The disqualified count fell by 669 overnight on Aug 9→10 with no public announcement. We hold both timestamps. The series moves both ways — net +235 over 7 days containing a -669 day. This is the kind of restatement that makes point-in-time archives valuable. ThreeFold: 7,498 registered nodes, 441 online (5.9%). 198,523 CPU cores registered, 9,198 online. 203 phantom nodes — up for 30+ days with zero CPU usage. This is a network where 94% of registered capacity is dark.What we refuse to publish
We refuse to publish numbers we can't verify or that answer different questions:
- Titan's storage utilization of 63.8× is impossible — the numerator and denominator don't measure the same thing. Refused.
- Seven of eight networks reporting fees and revenue as the identical number almost certainly aren't keeping 100% of what users pay. Their upstream source doesn't model the split. Only one take-rate got published.
- Akash's cumulative-lifetime lease denominator produces a 0.1% utilization figure that is meaningless. Refused.
The archive
The data is archived daily with point-in-time correctness. Each row is what was observable on that date — not what the API shows now. When Storj restated 669 nodes with no announcement, both values stayed in the archive with their timestamps. A backtest using our archive gets the Aug 9 value (80,238), not the later-revised value (79,569). No look-ahead bias.
This property is worth more than any single ratio. Anyone backtesting DePIN fundamentals from a public API today is fitting on restated data and doesn't know it.
The API
The data is available at kairossignal.com/v1/compare — 40 concepts across 297 cells, with comparability grades and verify URLs. Every cell links back to the upstream endpoint so you can check it yourself.
The utilisation page is at kairossignal.com/utilisation. It updates daily. The node-health page is at kairossignal.com/node-health. Both publish refusals alongside findings.
---
Kairos Signal collects first-party DePIN telemetry with point-in-time archiving. Every number has a verify URL. Every refusal is published. The archive is the moat — APIs show now; only this system stored then.---
Try it yourself
Query the live catalog, supply telemetry, and provenance receipts directly: /v1/networks, /v1/supply on the REST API.
Related reading: io.net GPU data · io net gpu supply data how many gpus are actually online · compute supply across Akash, io.net, Aethir · DePIN Intelligence guide
Design-partner seats are capped at 20 at a lifetime-locked $199/mo (full API access, every published endpoint, MCP server, Bitcoin-anchored provenance). After seat 20 the price becomes $249/mo. Claim a design-partner seat → · See pricing---
Get Started With DePIN Intelligence
Kairos Signal provides verifiable, provenance-first telemetry for DePIN networks, including first-party supply data read directly from a network's own API or blockchain. Every value carries a verify_url you can check yourself, and each daily batch is Merkle-rooted and anchored to Bitcoin.
Every API response is signed with ed25519 and timestamped. You can prove what was served and when, months later. That is what we mean by provenance-first.
Related reading: DePIN Intelligence Guide · DePIN Telemetry · How to Query DePIN Data · DePIN Data Verification · Pricing