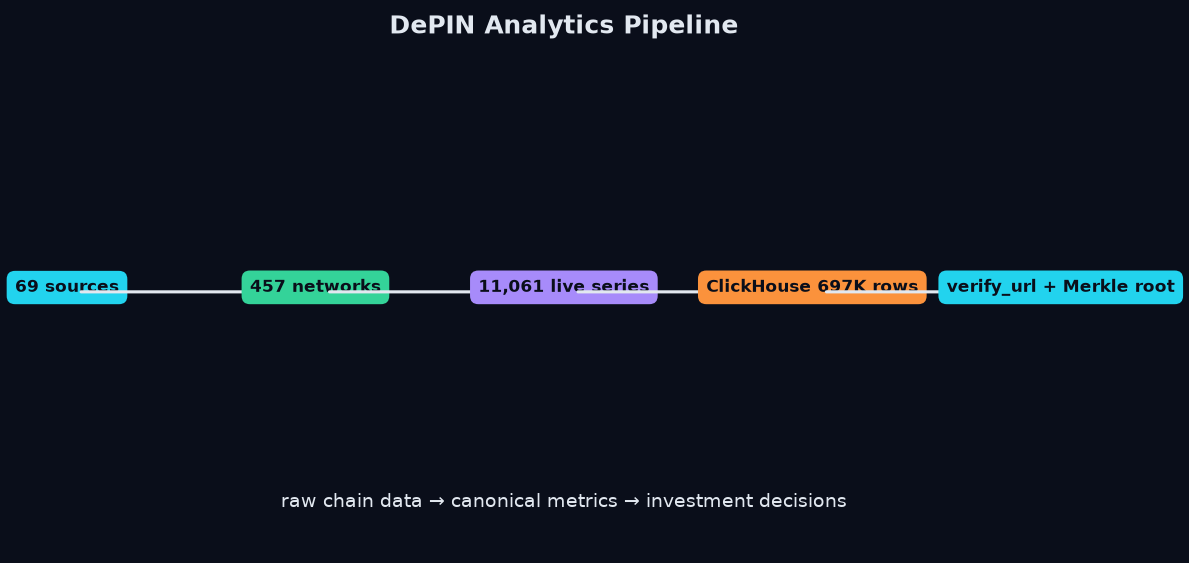
The Analytics Stack, End to End
Investment-grade DePIN analytics is not one tool — it is a pipeline. Raw chain data and API responses become canonical metrics, and canonical metrics become decisions. If any stage is opaque, the decision inherits the opacity.
Our pipeline has four stages:
DEVICES_ACTIVE and GPU_ACTIVE map into 38 canonical concepts with declared units.source, as_of, verify_url, and a freshness verdict.Why Raw Chain Data Is Not Enough
On-chain data tells you what the token did, not what the network did. Consider a compute network: the on-chain feed shows token supply and price; the telemetry layer shows active GPUs, active leases, and revenue. An investor who looks only at the token chart is flying blind on utilization, which is the fundamental health metric.
That is why our coverage tiers matter:
| Tier | Networks | Serves |
|---|---|---|
| First-party telemetry | 296 | Active nodes, supply, fees, utilization |
| On-chain market only | 78 | Token supply, price, holders |
| Catalog only | 339 | No live feed (labeled catalog_only) |
| Live total | 327 | Anything with a verifiable value |
The Metrics That Matter
From 11,857 live series, a handful of canonical concepts do the heavy lifting for decisions:
- Registered vs active supply — the utilization gap. Registered capacity climbing while active stays flat is idle inventory, not growth.
- Node counts — verifiable active nodes across networks, read from first-party endpoints rather than marketing pages.
- Protocol fees — which networks actually generate revenue, read from chain state.
- On-chain supply — token supply across 9 blockchains via RPC paths like
ethereum_rpc(32 networks),bsc_rpc(50), andsolana_rpc(49).
From Metric to Decision
The step that separates analytics from data is interpretation. A single metric is noise; a cross-network comparison is signal. Because we normalize into canonical concepts, you can query the same concept across networks:
# Compare GPU utilization across compute networks
curl "https://api.kairossignal.com/v1/compare?concept=GPU_UTILIZATION"
Protocol fees across a category
curl "https://api.kairossignal.com/v1/compare?concept=PROTOCOL_FEE"
Supply trend for one network
curl "https://api.kairossignal.com/v1/supply?network=akash&window=30d"
Every value is anchored: verify_url for the receipt, Merkle root for the batch, Bitcoin timestamp for the date. A backtest built on this data uses point-in-time values, not restated ones.
A Worked Example: Is This Compute Network Actually Tightening?
Suppose you are evaluating a compute DePIN. You pull two series:
gpu_active — active GPU count over 90 days.gpu_available — available GPU count over 90 days.If gpu_active climbs while gpu_available shrinks, demand is absorbing supply — genuine tightening. If gpu_active is flat but gpu_available is flat too, nothing is changing. If gpu_available is flat while registered capacity grows, the network is accumulating idle inventory. Three readings, three very different conclusions — and all of them require telemetry, not a token chart.
The Trust Layer
Analytics is only as good as the trust you place in the underlying numbers. Our provenance model — source, as_of, verify_url, freshness verdict, and Bitcoin anchoring — means you never have to take a number on faith. If we cannot verify a metric, we omit it rather than model it.
That is the difference between DePIN analytics and a dashboard with nice charts.
FAQ
What is the difference between DePIN analytics and DePIN market data? Market data tracks the token; analytics combines on-chain data with infrastructure telemetry to assess the network itself. Analytics is what answers "is this network working and earning?" Why does point-in-time data matter for backtesting? Because supply and fee figures get restated. A backtest on restated data trains on values that were never true. Bitcoin-anchored batches guarantee you get the value that was true on each date. Can an autonomous agent use this? Yes. The API serves values with full provenance (verify_url, as_of, freshness verdict), so an agent can verify before it acts. See our guide on autonomous agent data.
Explore the analytics API → · Get a free key →
The Divergence Framework
The most reliable analytical pattern in DePIN is divergence — the gap between two related layers that should move together. Three divergences carry most of the signal:
Each divergence is a two-series comparison. Because our data normalizes into canonical concepts, you can compute all three divergences across a whole category in a handful of queries — and rank networks by how much their layers diverge. That ranking is a practical diligence screen.
Building a DePIN Analytics Workflow
A rigorous workflow looks like this:
verify_url on any value that drives a decision.Each step is a small query, but together they turn raw chain data and telemetry into a defensible investment view. That is the discipline of DePIN analytics: not a single chart, but a repeatable, verifiable process.
Why This Beats a Dashboard
A dashboard shows you today's numbers. Analytics gives you a process for deciding what those numbers mean and whether you can trust them. When every value carries a source and a receipt, your conclusions can be audited — which matters when a position is sized on them. Analytics is the difference between "a chart said so" and "I verified the underlying data and the divergence is real."
Read more: DePIN Telemetry: 296 Networks · DePIN Data Feeds · DePIN Data Platform
---
This is a data product. Kairos Signal publishes no trading signals, performance returns, win rates, or accuracy claims.---
Try it yourself
Query the live catalog, supply telemetry, and provenance receipts directly: /v1/networks, /v1/provenance on the REST API.
Related reading: DePIN Intelligence guide · DePIN network data: 372 networks, 138 sources · how we read supply telemetry from 296 networks · the DePIN developer guide
Design-partner seats are capped at 20 at a lifetime-locked $199/mo (full API access, every published endpoint, MCP server, Bitcoin-anchored provenance). After seat 20 the price becomes $249/mo. Claim a design-partner seat → · See pricing---
Get Started With DePIN Intelligence
Kairos Signal provides verifiable, provenance-first telemetry for DePIN networks, including first-party supply data read directly from a network's own API or blockchain. Every value carries a verify_url you can check yourself, and each daily batch is Merkle-rooted and anchored to Bitcoin.
Every API response is signed with ed25519 and timestamped. You can prove what was served and when, months later. That is what we mean by provenance-first.
Related reading: DePIN Intelligence Guide · DePIN Telemetry · How to Query DePIN Data · DePIN Data Verification · Pricing