ThreeFold: 99.3% of Registered Cores Are Not Doing Work (Re-Measured Today)
We first published ThreeFold's idle-capacity numbers earlier this month. Numbers like that deserve to be re-measured, not repeated — so today we ran the whole measurement again from the public grid API. As of 2026-08-24T14:22Z:
- Registered grid (all statuses): 7,498 nodes, 198,523 CPU cores, across 4,353 farms in 78 countries
- Actually online right now: 443 nodes with 9,058 cores — 5.9% of registered nodes are up (443/7,498), with 37 more in standby
- Cores in use: 1,364 of the 9,058 online cores — 15.1% utilisation of online capacity (84.9% of online cores idle)
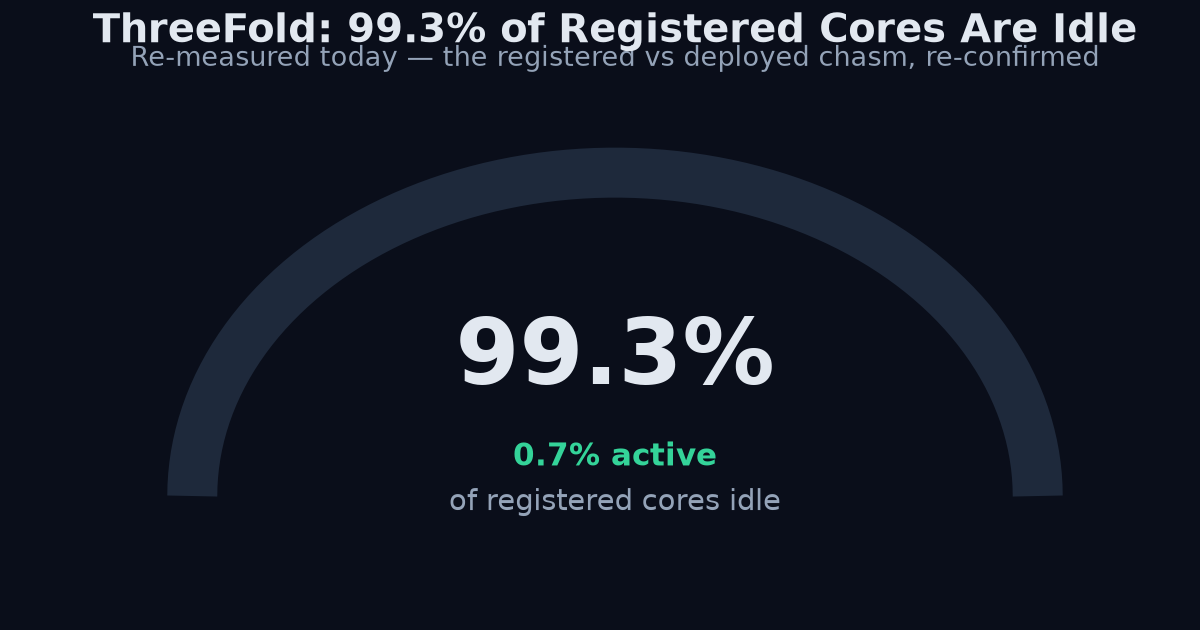
- Against the registered fleet: 1,364 used / 198,523 registered = 0.69%. In other words, 99.31% of registered ThreeFold compute is not in use.
Two denominators, both published
"The grid is 85% idle" and "the grid is 99.3% idle" are the same measurement with different denominators, and both are true:
Online basis (85% idle). Of the capacity that is switched on, provisioned, and reachable right now, 15.1% is doing work. This is the number that matters if you are asking "can this network serve a workload today?" — and the answer is yes, with enormous headroom. Registered basis (99.3% idle). Of everything the grid has ever registered, 0.69% is doing work. This is the number that matters if you are evaluating claims about network scale. When a DePIN network's headline is its registered fleet — 7,498 nodes, ~198k cores, 78 countries — the registered denominator is the honest one to hold that headline against.Most networks publish only the flattering ratio, if they publish a ratio at all. We publish both, with the denominator named, because the choice of denominator is the analysis. We wrote about the same trap on io.net, where a 96.8% "utilization" turned out to be a fill rate of active inventory: io.net's registered devices grew 26% while active stayed flat.
How we measured it
All three inputs come from ThreeFold's own public gridproxy API — no privileged access, no scraping:
/stats with no filter: node count, total CRU (cores), farms, countries./stats?status=up: the same fields restricted to nodes currently reporting up./nodes?status=up and summing each node's used_resources.cru. Today that sum is 1,364 across all 443 up nodes.Step 3 runs through a sanity gate before aggregation: any single node reporting used resources wildly in excess of its own total is rejected, not clamped. This is not hypothetical. One misreporting node once pushed the grid-wide CRU utilisation figure to 1.96e17%. Our collector withholds impossible ratios rather than silently capping them at 100% — a clamped number looks plausible and is therefore more dangerous than a missing one. Today's run rejected zero nodes; the 1,364 figure needed no cleaning.
Caveats, stated plainly
- "Up" is self-reported liveness. A node counts as up if it is reporting to the grid; we do not independently probe each node. The 37 standby nodes are excluded from the online denominator.
- Used CRU measures reservation, not CPU load. A reserved core running at 3% CPU still counts as "in use." If anything, this makes our utilisation figures generous — actual computational work is at or below what we report.
- Point-in-time. These are live counters, not daily averages. We archive each day's snapshot so the series is point-in-time correct — the archive holds what was observable on each date, not what the API shows now.
- This is one network's own API describing itself. We are not adjusting for nodes that may exist but never registered, nor for any off-grid workloads. The claim is precisely: of what ThreeFold's grid reports about itself, this is the used fraction.
Verify it yourself
Every number above reproduces from public URLs in under a minute:
# Registered grid (all statuses)
curl https://gridproxy.grid.tf/stats
→ nodes: 7498, totalCru: 198523, farms: 4353, countries: 78 (as of 2026-08-24)
Online right now
curl "https://gridproxy.grid.tf/stats?status=up"
→ nodes: 443, totalCru: 9058
Cores in use: page through up nodes, sum used_resources.cru
curl "https://gridproxy.grid.tf/nodes?status=up&size=200&page=1"
repeat with page=2,3... until empty; sum used_resources.cru
→ 1,364 as of 2026-08-24T14:22Z
If your sum differs by a few cores, that's the live grid moving. If it differs by an order of magnitude, check for a node reporting used > total — and reject it, don't clamp it.
Why this matters
ThreeFold is not an outlier in having idle capacity; it is an outlier in how measurable that idleness is, because its API exposes both registered and used resources per node. Across the DePIN sector, the gap between registered and utilised supply is the story almost nobody quantifies — we cover the general pattern in why registered capacity is not deployed capacity. ThreeFold is one of 8 networks where we currently hold a full utilisation pair (numerator and denominator, same unit) as of 2026-08-24, within a first-party estate of 428 networks and 3,878 first-party series.
Every figure we serve carries its source, timestamp, and a verify-yourself URL — the API is documented at kairossignal.com/api-docs, and you can query without signing up at /try.
---
Data access: free tier at /try, or the $199 Design Partner plan at /pricing.---
Try it yourself
Query the live catalog, supply telemetry, and provenance receipts directly: /v1/networks, /v1/supply on the REST API.
Related reading: DePIN Intelligence guide · DePIN network data: 372 networks, 138 sources · how we read supply telemetry from 296 networks · the DePIN developer guide
Design-partner seats are capped at 20 at a lifetime-locked $199/mo (full API access, every published endpoint, MCP server, Bitcoin-anchored provenance). After seat 20 the price becomes $249/mo. Claim a design-partner seat → · See pricing---
Get Started With DePIN Intelligence
Kairos Signal provides verifiable, provenance-first telemetry for DePIN networks, including first-party supply data read directly from a network's own API or blockchain. Every value carries a verify_url you can check yourself, and each daily batch is Merkle-rooted and anchored to Bitcoin.
Every API response is signed with ed25519 and timestamped. You can prove what was served and when, months later. That is what we mean by provenance-first.
Related reading: DePIN Intelligence Guide · DePIN Telemetry · How to Query DePIN Data · DePIN Data Verification · Pricing